

Asia-Pacific Artificial Lift Market
- Publish Date: Upcoming


The Asia-Pacific artificial lift market was valued at $1032.3 million in 2013 and is expected to reach $1729.5 million in 2018, growing at a CAGR of 10.9% from 2013 to 2018.
The Asia-Pacific market is segmented into types, including rod lift, ESP, PCP, gas lift, and others. The market is further segmented based on major countries, including China, Malaysia, India, Indonesia, and others.
The market report comprises profiles of the major participants in the market, such as Weatherford International Ltd (Switzerland), Schlumberger (U.S.), Baker Hughes (U.S.), and others.
Customization Options:
Along with the market data, customize the MMM assessments to meet your company’s specific needs. Customize to get a comprehensive summary of the industry standards and a deep dive analysis of the following parameters:
Product differentiation:
- Differentiating the companies on types of artificial lift tools offered
Expert insights:
- An in-depth value chain analysis of the market
- Interrelation between the segments
- Impact of segments on the market
- Brief information about oil basins and recent discoveries
1 Executive Summary.. 9
2 Introduction.. 11
2.1 Asia-Pacific Artificial Lift Services Market, Objectives of the study. 11
2.2 Market Definition.. 11
2.3 MARKET COVERAGE. 13
2.4 Stakeholders. 14
2.5 Research Methodology. 14
2.5.1 Approach.. 14
2.5.2 Market Size. 16
2.5.3 Key Secondary sources. 18
2.5.4 Key Primary sources. 18
2.6 Assumptions. 19
2.6.1 Cost trends. 19
2.6.2 Demand for Artificial Lift Equipment and services. 19
2.6.3 Exchange rates and currency conversion.. 19
2.6.4 Table totals. 19
2.6.5 Currency value. 19
2.6.6 Company financials. 20
2.7 Acronyms. 20
3 Artificial Lift Services Market, Market Dynamics. 22
3.1 Drivers and Restraints.22
3.1.1 Drivers. 22
3.1.1.1 Increased production from mature oil-fields. 22
3.1.1.2 Increase in heavy oil production. 23
3.1.1.3 Surge in energy demand. 23
3.1.1.4 Growing Offshore Exploration. 23
3.1.2 Restraints. 24
3.1.2.1 Shortage of technical professional 24
3.2 Auxilary factors. 24
3.2.1 China.. 35
3.2.2 Malaysia.. 36
3.2.3 India.. 37
3.2.4 Indonesia.. 38
3.3 Porter’s five forces analysis. 42
3.3.1 Suppliers’ power. 43
3.3.2 Threat of new entrants. 44
3.3.3 Buyers’ power. 44
3.3.4 Threat of substitutes. 45
3.3.5 Degree of competition.. 46
4 Artificial Lift- Asia-pacific Market, By Type, 2013 – 2018.. 47
4.1 Overview... 47
4.2 North American market, by Type. 47
5 Artificial Lift, Asia-pacific Market, By Country, 2013 – 2018.. 5
5.1 Overview... 53
5.2 Asia-pacific market, by Country. 53
6 Artificial LIFT: Competitive landscape. 59
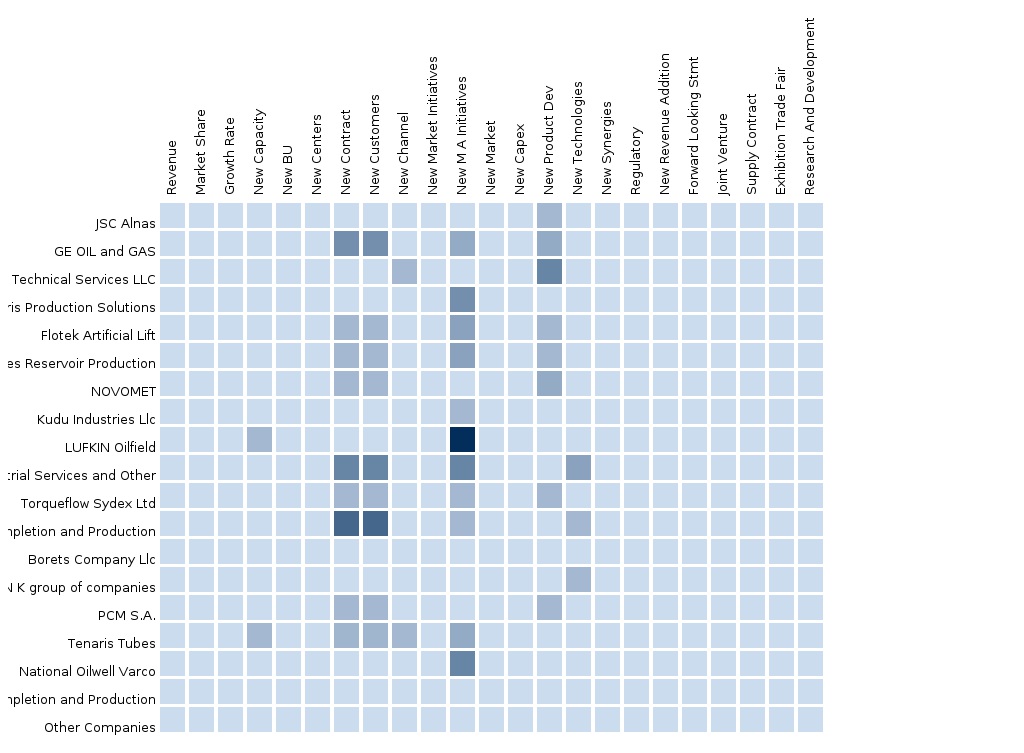
6.1 Developments: apac region, by companies. 60
7 Artificial lift-apac region, by companies.. 62
7.1 Weatherford international ltd. 62
7.1.1 Introduction.. 62
7.1.2 Products & services. 62
7.1.3 Financials. 64
7.2 Baker hughes. 65
7.2.1 Introduction.. 65
7.2.2 PRODUCTS & SERVICES. 65
7.2.3 Financials. 66
7.3 Schlumberger ltd. 67
7.3.1 Introduction.. 67
7.3.2 PRODUCTS & SERVICES. 67
7.3.3 Financials. 68
8 Artificial Lift. 70
8.1 Introduction.. 70
8.2 Market Segmentation.. 71
8.3 Technology. 72
8.3.1 Selecting the Artificial lift type. 73
8.4 Technical Restraints: 74
List of Tables
TABLE 1 Macro indicator Well count (UNIT) 25
TABLE 2 Active Artificial Lift Supported Well penetration (%), by geography, 2011 25
TABLE 3 Artificial Lift on the Basis of Working Principle 26
TABLE 4 Number of subsea wells start-up, 2010 – 2012 27
TABLE 5 Heavy Oil Reserve, by Major countries, 2010 (Billion barrel) 27
TABLE 6 Global Offshore Expenditure, by typeS, 2011 – 2018 ($Billion) 29
TABLE 7 Market Consolidation Trend 29
TABLE 8 Patent Analysis, by Companies, 2009 – 2012 32
TABLE 9 Artificial Lifts and factors resisting their growth 33
TABLE 10 Asia-pacific: oil scenario, 2007 – 2011 (MMBOE) 34
TABLE 11 China: Oil scenario, 2007 – 2011 (mmboe) 35
TABLE 12 Malaysia: Oil scenario, 2007 – 2011 (Mmboe) 36
TABLE 13 India: Oil scenario, 2007 – 2011 (Mmboe) 37
TABLE 14 Indonesia: Oil scenario, 2007 – 2011 (Mmboe) 38
TABLE 15 Demand of crude oil, by geography, 2007 - 2011 (‘000 bbl/day) 39
TABLE 16 Supply of crude oil, by geography, 2007 – 2011 (‘000 bbl/day) 39
TABLE 17 Change in crude oil consumption, by geography, 2007 – 2011 40
TABLE 18 Change in crude oil production, by regions, 2007 – 2011 41
TABLE 19 Market size, By top Country, 2012-2018 ($ MILLION) 48
TABLE 20 Market Share (%), By top Country, 2013 & 2018 48
TABLE 21 ROD LIFT Market SIZE, By Country, 2012 - 2018 ($ MILLION) 49
TABLE 22 ESP Market, By Countries, 2012 – 2018 ($ MILLION) 49
TABLE 23 Progressive Cavity Pump Market, By Country, 2012 – 2018 ($ MILLION) 50
TABLE 24 GAS LIFT Market, By Country, 2012 – 2018 ($ MILLION) 51
TABLE 25 Others Market, By Country, 2012 – 2018 ($ MILLION) 52
TABLE 26 Artificial lift Market, by country, 2012 – 2018, ($Million) 54
TABLE 27 China: Artificial LIFT market SIZE, by TYPE, 2012 – 2018 ($Million) 55
TABLE 28 Malaysia: Artificial LIFT market SIZE, by TYPE, 2012 – 2018 ($Million) 56
TABLE 29 India: Artificial LIFT market SIZE, by TYPE, 2012 – 2018 ($Million) 57
TABLE 30 Indonesia: Artificial LIFT market SIZE, by TYPE, 2012 – 2018 ($Million) 57
TABLE 31 Market Share(%), Companies: 2013 59
TABLE 32 Market Share(%), Companies: 2018 60
TABLE 33 APAC Region: DEVELOPMENTS 60
TABLE 34 WEATHERFORD INTERNATIONAL LTD.: PRODUCTS & services 63
TABLE 35 WEATHERFORD INTERNATIONAL: financials 64
TABLE 36 PRODUCTS & SERVICES 65
TABLE 37 baker hughes 66
TABLE 38 schlumberger ltd.: PRODUCTS & SERVICES 68
TABLE 39 schlumberger ltd.: Financials 68
TABLE 40 Active Artificial Lift Supported Well Count, by Geography, 2011 70
TABLE 41 Factors influencing Artificial lift method selection 73
TABLE 42 Artificial Lifts and factors resisting their growth 74
List of Figures
FIGURE 1 Market Segmentation 13
FIGURE 2 Research methodology 15
FIGURE 3 Data triangulation methodology 17
FIGURE 4 Artificial Lift Market, 2011-2018 22
FIGURE 5 Porter’s Five Force Analysis 42
FIGURE 6 Asia-Pacific- market revenue: Types (2013-2018) 47
FIGURE 7 Asia-Pacific- market split: Countries (2013) 53
FIGURE 8 Asia-Pacific- market size: countries (2011-2018) 54
FIGURE 9 WEATHERFORD INTERNATIONAL Ecosystem 65
FIGURE 10 schlumberger ltd.: ecosystems 69
FIGURE 11 MARKET SEGMENTATION, Artificial Lift 71
Please fill in the form below to receive a free copy of the Summary of this Report
Please visit https://www.micromarketmonitor.com/custom-research-services.html to specify your custom Research Requirement


