

Asia Pacific Nitrogenous Fertilizers Market by Type (Ammonia, Ammonium Nitrate, Ammonium Sulphate, Calcium Ammonium Nitrate, Urea and Others) by Application and by Country - Trends and Forecast Upto 2019
- Publish Date: Apr 2015


The Asia Pacific nitrogenous fertilizers market is estimated to grow at a CAGR of 2.1% in 2014 to 2019. Crops require different types of nutrients, such as nitrogen, phosphorus, sulfur, and potassium for its growth, of which nitrogen is the most essential nutrient for vegetative growth. The grains and oilseed crops require more amounts of nitrogenous fertilizers in terms of application as compared to fruits and vegetables.
In Asia Pacific, nitrogenous fertilizer are widely used in farm lands. It comes in different types like urea, calcium ammonium sulfate, ammonium nitrate, and others. Different nitrogenous fertilizers are required for different type of crops, and at different stages of plant growth. Ammonia and urea are most widely used for the grains and oilseeds crops in Asia-Pacific.
In 2014, China was the largest nitrogenous fertilizers market in Asia, by value, followed by Japan and India. In India, the pace of urbanization has resulted in the agricultural land being overtaken for commercial purposes to meet the demand of the rising population, without adequately compensating the land that has been used. The decrease in arable land and the fact that what remains is not replenished has led to a decrease in the amount of land available for agricultural purposes. Consequently, the demand for agricultural produce is increasing at a disproportionate rate and hence there is a need to increase the efficiency of land. Land efficiency is increased by the use of fertilizers and this has ultimately resulted in the increase in demand for nitrogen fertilizers.
The expanding Asia-Pacific market has many world leaders, which are competing for the largest chunk of market. Companies, such as Coromandel International Ltd. (India) have expansion strategies which help to expand their commercial prowess beyond India so as to cover the complete Asia-Pacific region.
Scope of the Report
This research report categorizes the Asia Pacific nitrogenous fertilizers market into the following segments and sub-segments:
Asia Pacific Nitrogenous Fertilizers Market, by Application
- Grain and Oilseeds
- Fruits and Vegetables
- Rest (crops)
Asia Pacific Nitrogenous Fertilizers Market, by Type
- Urea
- Ammonium Nitrate
- Ammonium Sulfate
- Calcium Ammonium Nitrate
- Other Nitrogenous Fertilizers
Asia Pacific Nitrogenous Fertilizers Market, by Geography
- China
- Japan
- India
- Others
Table of Contents
1 Introduction (Page No. - 10)
1.1 Objectives of the Study
1.2 Market Segmentation & Coverage
1.3 Stakeholders
2 Research Methodology (Page No. - 13)
2.1 Integrated Ecosystem of Nitrogenous Fertilizers Market
2.2 Arriving at the Nitrogenous Fertilizers Market Size
2.2.1 Top-Down Approach
2.2.2 Bottom-Up Approach
2.2.3 Demand Side Approach
2.2.4 Macro Indicator-Based Approach
2.3 Assumptions
3 Executive Summary (Page No. - 22)
4 Asia Pacific Nitrogenous Fertilizers Market Overview (Page No. - 24)
4.1 Introduction
4.2 Nitrogenous Fertilizers Market: Comparison With Parent Market
4.3 Market Drivers and Inhibitors
4.4 Key Market Dynamics
4.5 Demand Side Analysis
4.6 Vendor Side Analysis
5 Asia Pacific Nitrogenous Fertilizers Market, By Application (Page No. - 35)
5.1 Introduction
5.2 Demand Side Analysis
5.3 Vendor Side Analysis
5.4 Nitrogenous Fertilizers in Grains & Oilseeds, By Geography
5.5 Nitrogenous Fertilizers in Fruits & Vegetables, By Geography
5.6 Sneak View: Asia Pacific Nitrogenous Fertilizers Market, By Application
6 Asia Pacific Nitrogenous Fertilizers Market, By Type (Page No. - 47)
6.1 Introduction
6.2 Asia-Pacific Nitrogenous Fertilizers Market, Type Comparison With Fertilizers Market
6.3 Asia Pacific Urea Market, By Geography
6.4 Asia Pacific Ammonium Sulfate Market, By Geography
6.5 Asia Pacific Ammonium Nitrate Fertilizers Market, By Geography
6.6 Sneak View: Asia-Pacific Nitrogenous Fertilizers Market, By Type
7 Asia Pacific Nitrogenous Fertilizers Market, By Geography (Page No. - 57)
7.1 Introduction
7.2 Vendor Side Analysis
7.3 China Nitrogenous Fertilizers Market
7.3.1 China Nitrogenous Fertilizers Market, By Application
7.3.2 China Nitrogenous Fertilizers Market, By Type
7.4 Japan Nitrogenous Fertilizers Market
7.4.1 Japan Nitrogenous Fertilizers Market, By Application
7.4.2 Japan Nitrogenous Fertilizers Market, By Type
7.5 India Nitrogenous Fertilizers Market
7.5.1 India Nitrogenous Fertilizers Market, By Application
7.5.2 India Nitrogenous Fertilizers Market, By Type
8 Asia Pacific Nitrogenous Fertilizers Market: Competitive Landscape (Page No. - 75)
8.1 Asia-Pacific Nitrogenous Fertilizers Market: Company Share Analysis
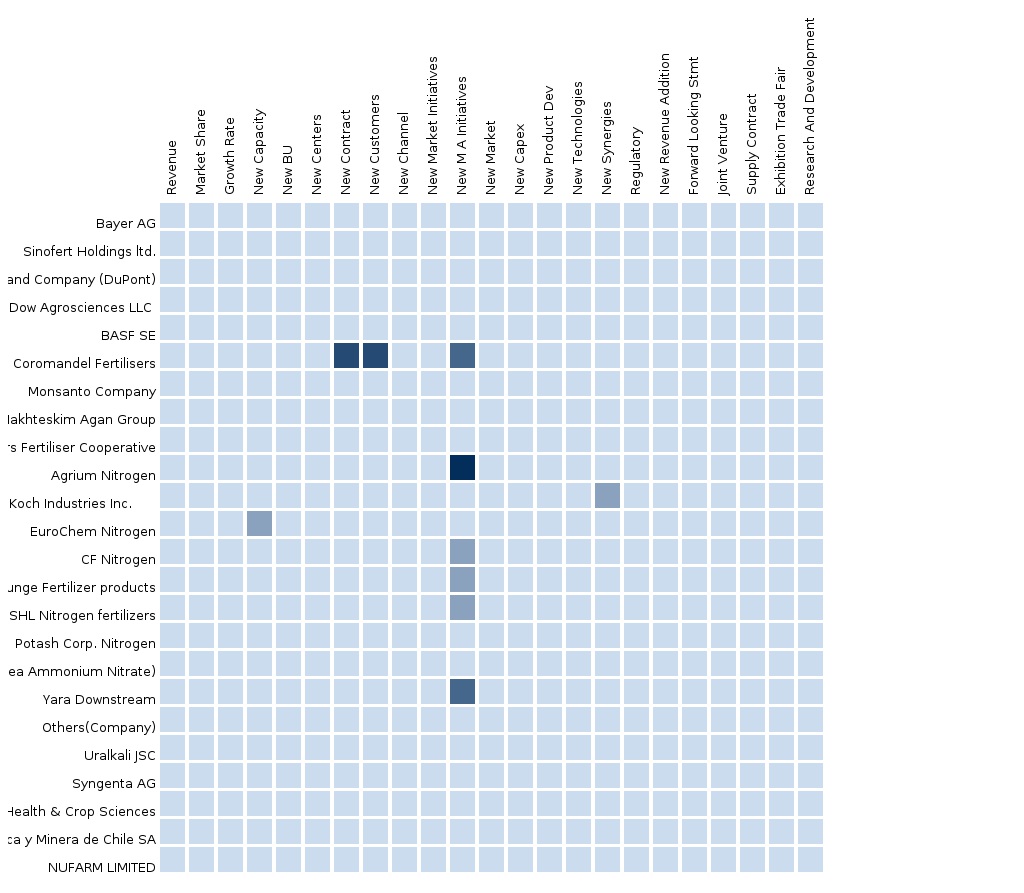
8.2 Company Presence in Nitrogenous Fertilizers Market, By Type
8.3 Expansions
8.4 Joint Ventures, Agreements, and Contracts
8.5 New Product Development
9 Asia Pacific Nitrogenous Fertilizers Market, By Company (Page No. - 80)
9.1 Agrium Inc.
9.1.1 Overview
9.1.2 Key Operations Data
9.1.3 Key Financials
9.1.4 Product and Service Offerings
9.1.5 Related Developments
9.1.6 MMM View
9.2 Eurochem Group
9.2.1 Overview
9.2.2 Key Financials
9.2.3 Product and Service Offerings
9.2.4 Related Developments
9.2.5 MMM View
9.3 Yara International Asa
9.3.1 Overview
9.3.2 Key Financials
9.3.3 Product and Service Offerings
9.3.4 Related Developments
9.3.5 MMM View
9.4 Coromandel International Limited
9.4.1 Overview
9.4.2 Key Financials
9.4.3 Product and Service Offerings
9.4.4 Related Developments
9.4.5 MMM View
9.5 SinofeRT Holding Ltd.
9.5.1 Overview
9.5.2 Key Financials
9.5.3 Product and Service Offerings
9.5.4 Related Developments
9.5.5 MMM View
9.6 Bunge Limited
9.6.1 Overview
9.6.2 Key Financials
9.6.3 Key Operations Data
9.6.4 MMM Analysis
10 Appendix (Page No. - 95)
10.1 Customization Options
10.1.1 Technical Analysis
10.1.2 Low-Cost Sourcing Locations
10.1.3 Regulatory Framework
10.1.4 Crop-Nitrogen Fertilizer Usage Data
10.1.5 Impact Analysis
10.1.6 Trade Analysis
10.1.7 Historical Data and Trends
10.2 Related Reports
10.3 Introducing RT: Real Time Market Intelligence
10.3.1 RT Snapshots
List of Tables (58 Tables)
Table 1 Global Nitrogenous Fertilizers Peer Market Size, 2014 (USD MN)
Table 2 Asia Pacific Nitrogenous Fertilizers Application Market, 2014 (KT)
Table 3 Asia-Pacific Nitrogenous Fertilizers Market: Macro Indicator, By Geography, 2014 (Ha)
Table 4 Asia-Pacific Nitrogenous Fertilizers Market: Comparison With Parent Market, 2013 – 2019 (USD MN)
Table 5 Asia-Pacific Nitrogenous Fertilizer Market: Comparison With Parent Market, 2013 – 2019 (KT)
Table 6 Asia Pacific Nitrogenous Fertilizer Market: Drivers and Inhibitors
Table 7 Asia Pacific Nitrogenous Fertilizer Market, By Application, 2013-2019 (USD MN)
Table 8 Asia Pacific Nitrogenous Fertilizer Market, By Application, 2013-2019 (KT)
Table 9 Asia Pacific Nitrogenous Fertilizer Market, By Type, 2013-2019 (USD MN)
Table 10 Asia Pacific Nitrogenous Fertilizer Market, By Type, 2013-2019 (KT)
Table 11 Asia Pacific Nitrogenous Fertilizer Market, By Geography, 2013-2019 (USD MN)
Table 12 Asia Pacific Nitrogenous Fertilizer Market, By Geography, 2013-2019 (KT)
Table 13 Asia Pacific Nitrogenous Fertilizer Market: Comparison With Application Market, 2013-2019 (USD MN)
Table 14 Asia Pacific Nitrogenous Fertilizer Market, By Application, 2013-2019 (USD MN)
Table 15 Asia Pacific Nitrogenous Fertilizers Market, By Application, 2013-2019 (KT)
Table 16 Asia Pacific Agricultural Land: Comparison With Grains & Oilseeds Application Market, 2013-2019
Table 17 Asia Pacific Agricultural Land: Comparison With Fruits & Vegetables Application Market, 2013-2019
Table 18 Asia Pacific Agricultural Land: Comparison With Rest (Crops) Application Market, 2013-2019
Table 19 Asia Pacific Nitrogenous Fertilizers in Grains & Oilseeds, By Geography, 2013-2019 (USD MN)
Table 20 Asia Pacific Nitrogenous Fertilizers in Grains & Oilseeds, By Geography, 2013-2019 (KT)
Table 21 Asia Pacific Nitrogenous Fertilizers in Fruits & Vegetables, By Geography, 2013-2019 (USD MN)
Table 22 Asia Pacific Nitrogenous Fertilizers in Fruits & Vegetables, By Geography, 2013-2019 (KT)
Table 23 Asia Pacific Nitrogenous Fertilizer Market, By Type, 2013-2019 (USD MN)
Table 24 Asia Pacific Nitrogenous Fertilizer Market, By Type, 2013-2019 (KT)
Table 25 Asia Pacific Nitrogenous Fertilizer Market: Type Comparison With Parent Market, 2013-2019 (USD MN)
Table 26 Asia Pacific Urea Market, By Geography, 2013-2019 (USD MN)
Table 27 Asia Pacific Urea Market, By Geography, 2013-2019 (KT)
Table 28 Asia Pacific Ammonium Sulfate Market, By Geography, 2013-2019 (USD MN)
Table 29 Asia Pacific Ammonium Sulfate Market, By Geography, 2013-2019 (KT)
Table 30 Asia Pacific Ammonium Nitrate Market, By Geography, 2013-2019 (USD MN)
Table 31 Asia Pacific Ammonium Nitrate Market, By Geography, 2013-2019 (KT)
Table 32 Asia Pacific Nitrogenous Fertilizer Market, By Geography, 2013-2019 (USD MN)
Table 33 Asia Pacific Nitrogenous Fertilizer Market, By Geography, 2013-2019 (KT)
Table 34 China Nitrogenous Fertilizers Market, By Application, 2013-2019 (USD MN)
Table 35 China Nitrogenous Fertilizers Market, By Application, 2013-2019 (KT)
Table 36 China Nitrogenous Fertilizers Market, By Type, 2013-2019 (USD MN)
Table 37 China Nitrogenous Fertilizers Market, By Type, 2013-2019 (KT)
Table 38 Japan Nitrogenous Fertilizers Market, By Application, 2013-2019 (USD MN)
Table 39 Japan Nitrogenous Fertilizers Market, By Application, 2013-2019 (KT)
Table 40 Japan Nitrogenous Fertilizers Market, By Type, 2013-2019 (USD MN)
Table 41 Japan Nitrogenous Fertilizers Market, By Type, 2013-2019 (KT)
Table 42 India Nitrogenous Fertilizers Market, By Application, 2013-2019 (USD MN)
Table 43 India Nitrogenous Fertilizers Market, By Application, 2013-2019 (KT)
Table 44 India Nitrogenous Fertilizers: Market, By Type, 2013-2019 (USD MN)
Table 45 India Nitrogenous Fertilizers: Market, By Type, 2013-2019 (KT)
Table 46 Nitrogenous Fertilizers Market: Company Share Analysis, 2013 (%)
Table 47 Asia Pacific Nitrogenous Fertilizer Market: Expansions
Table 48 Asia Pacific Nitrogenous Fertilizer Market: Joint Ventures, Agreements, and Contracts
Table 49 Asia Pacific Nitrogenous Fertilizer Market: New Product Development
Table 50 Agrium, Inc.: Key Operations Data, 2009-2013 (USD MN)
Table 51 Agrium, Inc.: Key Financials, 2009-2013 (USD MN)
Table 52 Eurochem Group: Key Financials, 2009- 2013 (USD MN)
Table 53 Yara International Asa: Key Financials, 2009-2013 (USD MN)
Table 54 Coromandel International Limited: Key Financials, 2010-2013 (USD MN)
Table 55 SinofeRT Holdings Ltd.: Key Financials, 2009-2013 (USD MN)
Table 56 Bunge Limited: Key Financials, By Business Segment, 2009-2013 (USD MN)
Table 57 Bunge Limited: Key Financials, By Geography, 2009-2013 (USD MN)
Table 58 Bunge Limited: Key Operation Data, 2009-2013 (USD MN)
List of Figures (56 Figures)
Figure 1 Asia Pacific Nitrogenous Fertilizers: Segmentation & Coverage
Figure 2 Nitrogenous Fertilizers Market: Integrated Ecosystem
Figure 3 Research Methodology
Figure 4 Top-Down Approach
Figure 5 Bottom-Up Approach
Figure 6 Demand Side Approach
Figure 7 Macro Indicator-Based Approach
Figure 8 Asia-Pacific Nitrogenous Fertilizers Market Snapshot
Figure 9 Nitrogenous Fertilizers Market: Growth Aspects
Figure 10 Asia-Pacific Nitrogenous Fertilizer Market: Comparison With Parent Market
Figure 11 Asia-Pacific Nitrogenous Fertilizer Market, By Application, 2014 & 2019
Figure 12 Asia Pacific Nitrogenous Fertilizers Type, By Geography, 2014 (USD MN)
Figure 13 Asia-Pacific Nitrogenous Fertilizer Market: Growth Analysis, By Type, 2014–2019 (%)
Figure 14 Asia-Pacific Nitrogenous Fertilizer Market: Comparison With Application Market, 2013–2019 (USD MN)
Figure 15 Asia Pacific Nitrogenous Fertilizers Producers Wallet Share on Ingredients, 2014
Figure 16 Nitrogenous Fertilizers: Application Market Scenario
Figure 17 Asia-Pacific Nitrogenous Fertilizer Market, By Application, 2014 & 2019 (USD MN)
Figure 18 Asia-Pacific Nitrogenous Fertilizer Market, By Application, 2014 & 2019 (KT)
Figure 19 Asia-Pacific Agricultural Land: Comparison With Grains & Oilseeds Application Market, 2013–2019
Figure 20 Asia-Pacific Agricultural Land: Comparison With Fruits & Vegetables Application Market, 2013–2019
Figure 21 Asia-Pacific Agricultural Land: Comparison With Rest (Crops) Application Market, 2013–2019
Figure 22 Asia-Pacific Nitrogenous Fertilizer Market: Vendor Side Analysis
Figure 23 Asia-Pacific Nitrogenous Fertilizers Market in Grains & Oilseeds, By Geography, 2013-2019 (USD MN)
Figure 24 Asia-Pacific Nitrogenous Fertilizers Market in Fruits & Vegetables, By Geography, 2013-2019 (USD MN)
Figure 25 Sneak View: Asia-Pacific Fertilizer Market
Figure 26 Asia-Pacific Nitrogenous Fertilizers Market, By Type, 2014 & 2019 (USD MN)
Figure 27 Asia-Pacific Nitrogenous Fertilizers Market, By Type, 2013 & 2018 (KT)
Figure 28 Asia-Pacific Nitrogenous Fertilizers Market: Type Comparison With Fertilizers Market, 2013–2019 (USD MN)
Figure 29 Asia-Pacific Urea Market, By Geography, 2013-2019 (USD MN)
Figure 30 Asia-Pacific Ammonium Sulphate Market, By Geography, 2013-2019 (USD MN)
Figure 31 Asia-Pacific Ammonium Nitrate Market, By Geography, 2013-2019 (USD MN)
Figure 32 Asia-Pacific Fertilizers Market, By Type 2014, (KT)
Figure 33 Asia-Pacific Nitrogenous Fertilizers Market: Growth Analysis, By Geography, 2014 & 2019 (USD MN)
Figure 34 Asia-Pacific Nitrogenous Fertilizers Market: Growth Analysis, By Geography, 2014 & 2019 (KT)
Figure 35 China Nitrogenous Fertilizers Market Overview, 2014 & 2019 (%)
Figure 36 China Nitrogenous Fertilizers Market, By Application, 2013-2019 (USD MN)
Figure 37 China Nitrogenous Fertilizers Market: Application Snapshot
Figure 38 China Nitrogenous Fertilizers Market, By Type, 2013-2019 (USD MN)
Figure 39 China Nitrogenous Fertilizers Market Share, By Type, 2014& 2019 (%)
Figure 40 Japan Nitrogenous Fertilizers Market Overview, 2014 & 2019 (%)
Figure 41 Japan Nitrogenous Fertilizers Market, By Application, 2013-2019 (USD MN)
Figure 42 Japan Nitrogenous Fertilizers Market: Application Snapshot
Figure 43 Japan Nitrogenous Fertilizers Market, By Type, 2013-2019 (USD MN)
Figure 44 Japan Nitrogenous Fertilizers Market Share, By Type, 2014-2019 (%)
Figure 45 India Nitrogenous Fertilizers Market Overview, 2014 & 2019 (%)
Figure 46 India Nitrogenous Fertilizers Market, By Application, 2013-2019 (USD MN)
Figure 47 India Nitrogenous Fertilizers Market: Application Snapshot
Figure 48 India Nitrogenous Fertilizers Market, By Type, 2013-2019 (USD MN)
Figure 49 India Nitrogenous Fertilizers Market: Type Snapshot
Figure 50 Nitrogenous Fertilizers Market: Company Share Analysis, 2014 (%)
Figure 51 Nitrogenous Fertilizers: Company Product Coverage, By Type, 2014
Figure 52 Agrium Inc. Revenue Mix, 2013 (%)
Figure 53 Eurochem Group Revenue Mix, 2013 (%)
Figure 54 Yara International Asa Revenue Mix, 2013 (%)
Figure 55 SinofeRT Holdings Ltd.: Revenue Mix 2013 (%)
Figure 56 Bunge Limited: Revenue Mix 2013 (%)
Fertilizers are used to aid the growth of crops, particularly when the soil lacks vital nutrients. Nitrogen is one of the key elements required for a healthy crop. Crops that grow with the help of nitrogenous fertilizers usually have bettersuperior and higher growth rates. This is because the nitrogen in the fertilizers assimilates into the chlorophyll, generating a better rate ofenabling the process of photosynthesis for the plant. The use of nitrogenous fertilizers also gives crops a better color and texture.
Nitrogen is a vital nutrient for the proper growth and development of plants. Though nitrogen is present in large quantities in the Earth’s atmosphere, not all plants and crops are capable of converting it. into a usable form. A nitrogenous fertilizer is an inorganic fertilizer containing nitrous compounds, for example, ammonium nitrate. It is available in two forms: dry pellets, which are scattered on the surface of the soil by hand or by machine; and liquid, which needs to be mixed with the soil.
The purpose of this study is to analyze the Asia-Pacific market for nitrogenous fertilizers market. This report includes revenue forecasts, market trends and opportunitiesprospects for the estimated period from 2014 to 2019. The analysis has been conducted on the various market segments derived on the basis of application of nitrogenous fertilizers. The market has been further segmented and analyzed on the basis of types of nitrogenous fertilizers. types.
The Asia Pacific Nitrogenous Fertilizers market was valued at $62,145.47 million in 2014 and is projected to reach $69,038.63 million by 2019 at a CAGR of 2.1% during the forecast period. The market, by application has been led by grains and oilseeds in 2014. The Urea is mostly used nitrogenous fertilizers in Asia- Pacific. The China has the largest share in the Asia- Pacific nitrogenous fertilizers market. It constitutes of 47.28% of the Asia- Pacific nitrogenous fertilizers market.
Please visit https://www.micromarketmonitor.com/custom-research-services.html to specify your custom Research Requirement


